
What I Look For To Understand My Own Classroom
A reflection on different lenses when asked, "how is your classroom doing?"

The 9th chapter of ’s Becoming an Everyday Changemaker begins with her sharing about the Vermont 251 Club, which started with a professor in 1954 suggesting that, by visiting all the towns in the state, people would “come to know the real Vermont” (169).
(Venet also notes: there are 252 towns now in Vermont.)
The rest of this chapter builds on the spirit of this analogy as it discusses with an abundance lens the many different “data” we can seek out to understand any classroom, building, or community we are a part of—and, in doing so, to resist the traditional, “satellite data” (173) that are too-often heavily relied upon in our current education system.
After my own venting experience a couple chapters back, I read this chapter with a healthy amount of confidence and affirmation: this is actually something I feel really good about in my classroom.
Today, then? I want to share what I personally consider as a teacher if I’m asked how my classroom is going, including the data that I collect and reflect upon and some resources that may be helpful for other educators looking to expand how they look at their own spaces. (Reminder: you can access all the other reflections for this book study from myself and if you click on this link!)
First, though, a quick summary of the ninth chapter of Venet’s book (a book that, I hope it goes without saying at this point, continues to be an absolute godsend for me in the journey that has been this school year):

Chapter 9 Summary: Following the Vermont 251 Club anecdote, Venet opens Chapter 9 by acknowledging how “[i]n today’s educational landscape, ‘evidence’ reigns” (173), offering how PBIS data is often utilized as an example of what downsides can look like in data collecting processes.
Then, though, Venet pivots to different, better “streams of information," starting with Jamila Dugan and Shane Safir’s work with “street data” (173) that can work alongside other, more traditional and quantitative forms of data.
Venet also offers analogies such as “attunement” (176) and “nourishment” (177) as different ways to consider our own practices around not just data but really the pursuit of a fuller, deeper understanding of all that our work involves—and most especially the students we serve as educators. Indeed, Chapter 9 encourages a reconceptualizing of what we think of when we hear the word “data” and, most certainly, what values we express in how we seek it out ourselves.

“How are things going in the classroom right now?”
We get asked this a lot as teachers. From informal hallway conversations between classes; to “bellringer” openings of many PLC and PD meetings; to formal reflections during annual evaluation conferences. (And, in rare moments of pause and reflection, to ourselves via the mirror.)
Yes, we all end up answering this question quite frequently, I think, but what I want to center today is the five lenses of “data” that inform my own way of answering this important question:
Monthly Check-in Surveys
Classroom Learning Data
Student Learning Reflections
Classmate Celebrations
Informal Vibe Checks
Through the rest of this reflection, I am going to share examples of each of these “streams of information” in my own practice as a teacher—along with a brief, culminating reflection of what is on my mind going forward around this topic.

Lens #1 - Monthly Check-in Surveys
This is a system that I pretty much stole completely from Jim’s sharing last year. Each month I ask students anonymously, “how are things going in our classroom, 1-7?” as well as how things are going in their other classes. (I’ve also added a semantic survey element to focus more on an emotions-lenses, something I got from this post over the summer from Cult of Pedagogy.)
Why this data matters: it gives me a great snapshot of the experience of students in my own classroom as well as the rest of their day and, more importantly, opens the door to really important conversations in our classroom. The image shared above, for example, was the beginning of a collaborative discussion with my English 10 students after our November survey—one that I believe modeled what it looks like to be transparent and humble as a teacher in sharing results of a survey and resulted in me hearing from students about what they thought would help make their overall experience better across their classes. A win/win, for sure.

Lens #2 - Classroom Learning Data
I’m going to set aside the big three data numbers of education—attendance, grades, standardized test scores—that tend to get the most attention since, in my view, they are very rarely representative of my own classroom community and my agency within it as a teacher. What is representative? Individual and collective results of students on our classroom assessments.
Why this data matters: I continue to be a firm proponent of every teacher being able to know and share what their students have learned at any point in the year—this is foundational to our work, I believe, and credibility is lost when we cannot communicate this with confidence and precision as teachers. What I’ve also found, though, is that it helps inject purpose to our classroom when I can share data like the slide pictured above, in which the momentum students are earning through their own investment (in this case, on analytical essays) is made visible. Prioritizing classroom learning data also allows me to be responsive to where students are in the classroom throughout the year in an authentic, needed manner.

Lens #3 - Student Learning Reflections
I know I’m somewhat of a broken record on this, but I believe that embedding opportunities for students to reflect on their learning throughout their experience in the classroom is essential—particularly in this moment. From end-of-task confidence surveys (see above) to self-assessments on projects to broader systems that can track ongoing reflections over the year, there are so many different ways for you to create space for reflection in the classroom and, as a result, to express how much you value it. (Still one of my favorite conversations of 2024: this discussion with Through the Educational Looking Glass on this topic!)
Why this data matters: if I had to pick any of the lenses shared in this post, this might be the best tool I have for really understanding how students are doing because it allows me to know how students feel that they are doing—and then to have needed follow-up conversations based off these, both individually and as a class, collecting the type of “street data” (173) Venet celebrates in Chapter 9. Furthermore, when I step back and consider those reflections at scale and over time, it can provide the ingredients to a clear, authentic story of the classroom for any given year. (And as Venet notes in Chapter 9, stories are very much a part of data!)

Lens #4 - Classmate Celebrations
Remember that monthly check-in form? Included with it now in our classroom is a space for students to nominate peers to “sign the wall”—a system that has been in my classroom for a decade now. Students are provided space to name how a classmate is making our community between in alignment with our classroom core beliefs (or they can reflect on something they are proud of themselves for, too, if they want); then I read out the nominations and students cheer each other on for “signing the wall” the next lesson.
Why this data matters: As you can see in the three peer nominations pictured above, students say some pretty cool things about each other when you give them a chance! But what I’ve sometimes underrated, I think, is the “data” I get from this system in how students see each other. Time after time, I get to see not only who is making a positive impact in the classroom but also the trends in what actions and values are being celebrated. Quite a lens into the classroom community, right?
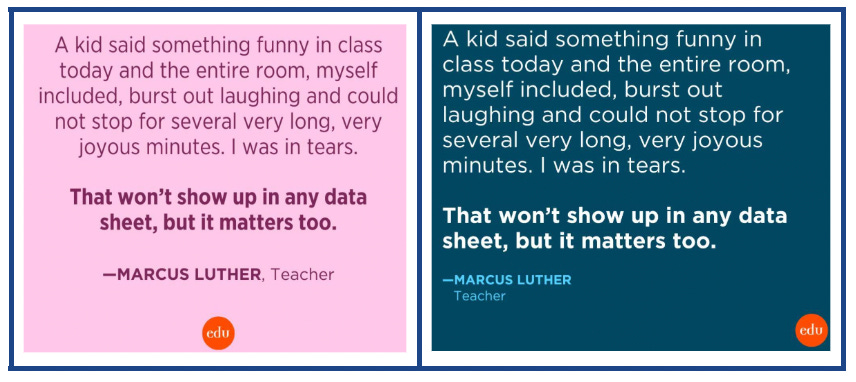
Lens #5 - Informal Vibe Checks
Pictured above are two screenshots of a quote that has been making its way around the internet via Edutopia’s social media feeds the past few years—so much so that I still get random texts from friends I haven’t talked to in years sharing it with me and adding, “this you???”
I’m sure at some point it will disappear, but the sentiment behind it is something I still stand by: joy matters in the classroom. And therefore it is something I try to pause and consider from time to time about each of my classes: how frequently are students talking with each other? Smiling at each other? Laughing?
Why this data matters: How students feel in a space is no small thing—really, it can be a definitive thing. I’ve tried to create surveys to capture this, but at the end of the day, if I’m really being honest with myself, I know the answers to the questions above. I know the classes where the smiles are genuine and the laughter is affirming; I know the classes where collaborative discussion isn’t just academic but authentic; I know the classes that simply feel good to be in. Just because I can’t precisely quantify it in a data sheet doesn’t mean it doesn’t matter.
(In fact, that might mean it matters most of all.)
Are 5 Lenses Enough? No.
Part of the gift of reading Chapter 9 for me was how this chapter pushed me to consider what other “streams of information” I could explore to better understand my own classroom and, ultimately, beyond my classroom, too.
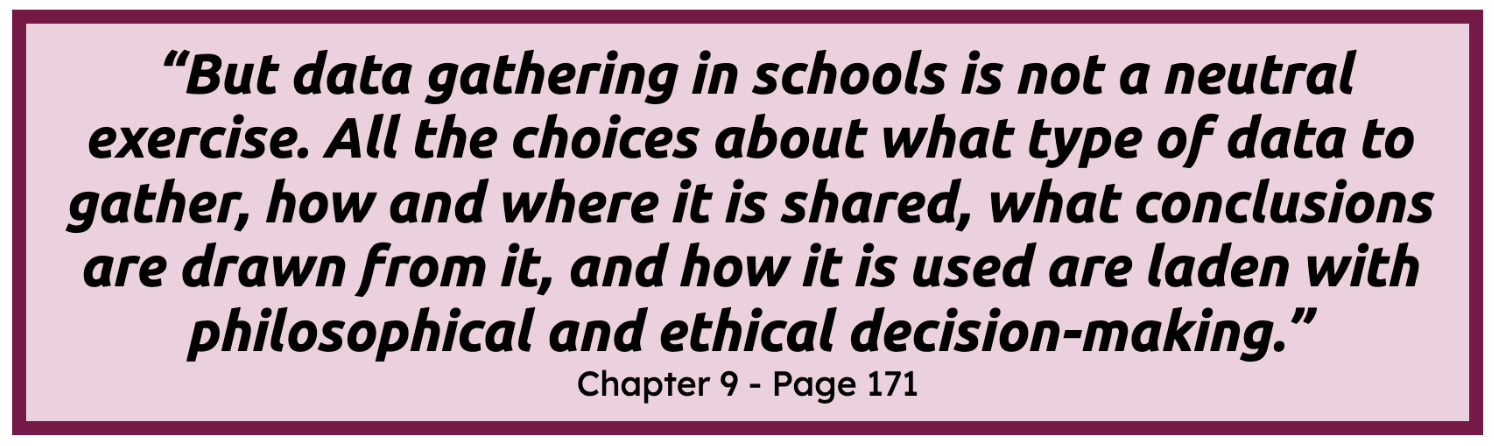
Given what Venet writes about how none of this is a neutral exercise, I find myself considering how I can advocate for better “data collecting” (and, really, prioritizing) within our school community and even outside of it. Inevitably, what happens in the classroom takes place under the umbrella of all that is occurring above and outside it in our education system—and speaking up with an eye towards the “philosophical and ethical decision-making” inherent in those choices and practices with data is a conviction this chapter deepened in me.
Unquestionably, there’s a lot of work left to do.
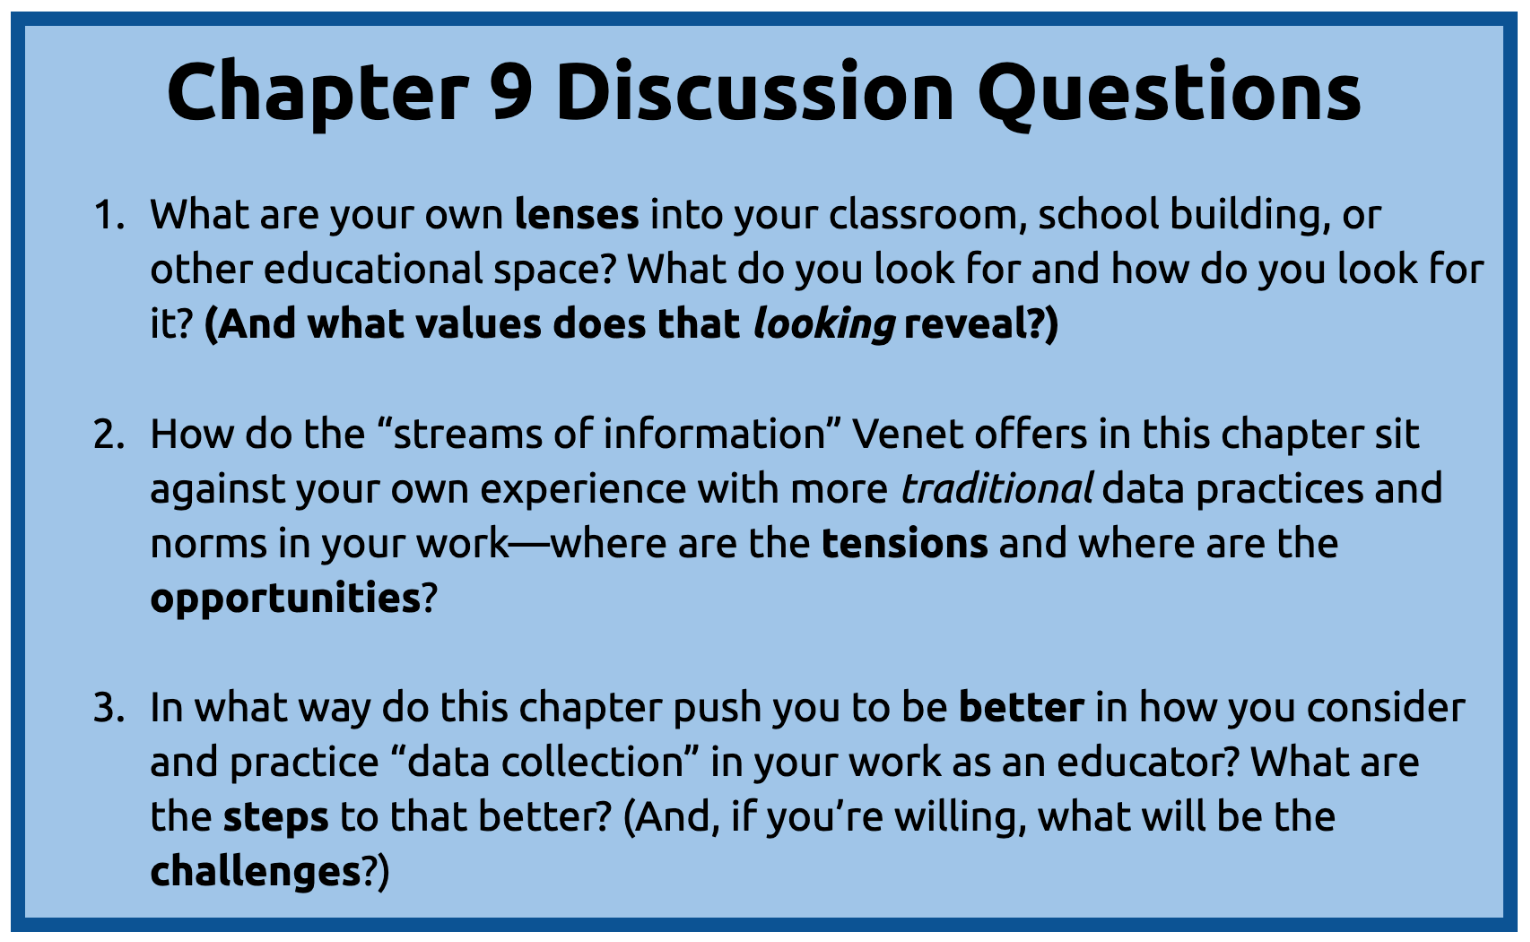
So what did everyone think of Chapter 9?
Feel free to respond to the discussion questions above, or to pose your own questions, too! (Reminder: you do not need to have a Substack account or subscribe to join the conversation.)
See you in the comments—and then next week at Adrian’s Newsletter to talk about the tenth chapter of this book as we begin our homestretch in this journey!
Good one! In coaching, structured reflection tools—such as post-session surveys, self-assessments, or ongoing reflection journals—allow adults to articulate their learning and identify areas for improvement. These reflections also set the stage for meaningful follow-up conversations, turning the abstract process of learning into a story of progress. Just as in classrooms, this practice not only strengthens individuals’ self-awareness but also builds trust and collaboration through shared accountability for growth.
“Then, though, Venet pivots to different, better “streams of information," starting with Jamila Dugan and Shane Safir’s work with “street data” (173) that can work alongside other, more traditional and quantitative forms of data.”
Honestly Marcus, I have been screaming into the void lately looking for someone to back me up that what we consider to be ‘data’ and ‘evidence’ is too narrow, too numerical and ignores why things are the way they are.
Absolutely throwing this article at everyone I know 😂